

Average True Range (ATR)
Traders who do technical analysis can utilize many different indicators, and one of them is the Average True Range (ATR). ATR measures market volatility for a period of time by decomposing the entire price range for an asset for that period.
The Average True Range is useful because ordinary high-to-low price ranges do not always capture the full amount of movement that has taken place. If an asset gaps sharply between one trading session and the next, measuring only the current session’s high and low can understate how volatile the market actually was. ATR attempts to solve this problem by comparing the current trading range with the previous closing price.
ATR is therefore a volatility indicator rather than a trend indicator. A rising ATR tells us that price movement has generally become larger, while a falling ATR tells us that trading ranges have generally become smaller. Neither result tells us whether buyers or sellers are in control.
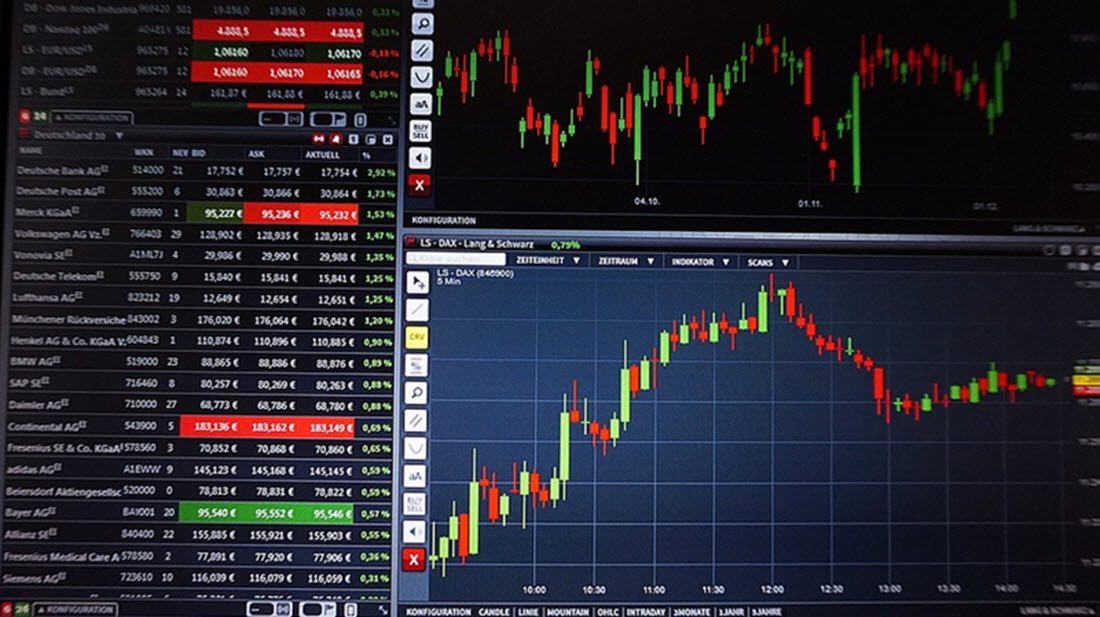
The ATR indicator was introduced by J. Welles Wilder Jr. In his book ”New Concepts in Technical Trading Systems”. The ATR was originally developed for the commodities market, but is today used in many other markets as well.
Wilder developed several indicators that later became widely used in technical analysis. ATR was particularly useful for commodities because those markets can experience gaps between trading sessions and sharp changes in daily range. A simple high-minus-low calculation could miss much of that movement, so the true range concept included the previous close as an additional reference point.
Today, ATR is commonly applied to shares, stock indices, forex, futures, commodities and other actively traded markets. Most charting platforms calculate it automatically, so traders rarely need to work through the formula manually. Knowing how the calculation works is still useful because it explains what information the indicator contains and, just as importantly, what it does not contain.
Among technical analysis traders, the most commonly used ART is the one derived from the 14-day simple moving average of a series of true range indicators. Each true range indicator is taken as the greatest of the following: current high less the current low; the absolute value of the current high less the previous close, and the absolute value of the current low less the previous close.
The logic behind taking the greatest of these three values is to make sure that overnight gaps or large jumps from the previous close are not ignored. If today’s price range is relatively small but the asset opened far above yesterday’s close, the distance from the previous close to today’s high can better represent the actual movement experienced by the market.
The same applies to a downside gap. If a stock closes at $100 and opens the next session at $90, an ordinary high-to-low measurement for the new session could be quite small even though traders have just experienced a very large move. True range takes the previous close into account and therefore captures more of the volatility associated with the gap.
As you can see, finding a series of true range values for the asset is a necessary step when calculating the ATR for the asset. For a given trading day, the price range for an asset is the highest value minus the lowest value.
Once the true range has been calculated for each period, those values are smoothed over the selected number of periods. Fourteen periods is common, but the period can be adjusted depending on the trading method and chart being used.
What does true range measure?
True range attempts to measure the largest meaningful movement associated with a single period. This is why it compares the current high and low with the previous close rather than relying on just one measurement.
Consider a share that closed yesterday at $50. Today it trades between $49 and $51. The ordinary range is $2. If yesterday’s close was also inside today’s trading range, that $2 figure is probably a reasonable description of the day’s movement.
Now suppose the same share closed yesterday at $50 but opened today at $55 and traded between $54.50 and $56. The high-to-low range is only $1.50, yet the move from the previous close to today’s high is $6. True range uses the larger figure, allowing the volatility calculation to reflect the overnight gap.
This feature is one of the main reasons ATR is more informative than a simple average of daily high-to-low ranges in markets where gaps occur regularly.
The formulas:
TR=Max[(H − L),Abs(H − CP),Abs(L − CP)]ATR=(n1)(i=1)∑(n)TRi
TRi=A particular true range
n=The time period employed
In practical charting software, ATR is normally plotted as a separate line below the main price chart. The number shown on the ATR axis is expressed in the same price units as the underlying market. If a stock has an ATR of $2.50, that means its average true range over the selected period has been approximately $2.50 per period.
For forex, the ATR can be translated into pips. If EUR/USD has a daily ATR equivalent to 80 pips, the pair has recently moved about 80 pips per day on average according to the selected calculation period. Traders can then compare the current day’s movement with that recent norm.
Is 14 days the only option?
No. 14 days is just the most commonly utilized period when calculating ATR.
Shorter settings make the ATR react more quickly to changes in volatility. A five-period ATR, for example, places much more weight on recent market behaviour than a 20-period or 50-period ATR. This can be useful for very short-term traders who want the indicator to adjust rapidly when the market becomes more or less active.
Longer ATR settings produce a smoother reading. They react more slowly to individual spikes in volatility and can be useful for traders who want a broader picture of normal market movement rather than a highly responsive short-term signal.
The chart interval also matters. A 14-period ATR on a daily chart measures volatility over 14 daily periods. A 14-period ATR on a one-hour chart measures 14 hourly periods. The setting is therefore better thought of as 14 periods rather than always 14 calendar days.
A trader should choose the period according to the strategy being used. A day trader can prefer a short ATR on a five-minute or 15-minute chart, while a swing trader can use a 14-day ATR or another longer setting on a daily chart.
Why is knowning the ATR good?
For a trader, knowing the average true range can be helpful since it indicate historical volatility for the asset. An asset that has experienced higher volatility (during the selected time period) will have a higher ATR than an asset that has experienced lower volatility.
Technical analysis traders can use the ATR to determine when to open and close positions. The ATR can also give a trader an indication of what size trade to put on in derivatives markets. (The trader must first determine their own risk-willingness for the trade.)
One of the most practical uses is deciding whether a planned stop is realistic relative to normal market movement. If an asset typically moves $4 per day and a trader places a stop only $0.25 from the entry, ordinary price noise might be enough to trigger the stop even if the larger trading idea remains valid.
ATR can also help traders compare current market conditions with recent history. If ATR has been falling for several weeks, the market has generally been becoming quieter. If it begins rising sharply, price movements are becoming larger. This can affect the suitability of strategies designed for calm or volatile markets.
Important: The ATR does not indicate price direction, and will not tell us in which direction the breakout will occur.
This is one of the most important limitations of ATR. A rapidly rising ATR can occur during a powerful rally, a violent decline or a market that is swinging aggressively in both directions. The indicator measures the magnitude of price movement, not whether that movement is bullish or bearish.
Some traders add the ATR to the closing price and then open a position as soon as (if) the price reaches above that value the following trading day.
This type of rule attempts to distinguish an unusually large upward move from ordinary daily fluctuation. If the price moves more than a normal amount above the previous close, the trader can interpret this as evidence that momentum or a breakout is developing. The same concept can be applied below the closing price for bearish setups.
Using ATR for stop-loss placement
ATR is commonly used to place stops at a distance related to recent volatility. Instead of giving every market the same fixed stop, a trader can adjust the distance according to how much the asset normally moves.
Suppose Stock A has an ATR of $1 while Stock B has an ATR of $8. A fixed $2 stop might be relatively wide for Stock A but extremely tight for Stock B. Using an ATR-based method allows the stop to reflect each market’s current behaviour.
A trader might use one ATR, 1.5 ATR or two ATR below an entry price depending on the trading system. There is no universal multiple that works best for every market. A larger multiple gives the trade more room but increases the amount at risk unless position size is reduced.
This relationship between stop distance and position size is important. If volatility rises and the ATR-based stop becomes wider, a trader who wants to keep the same monetary risk would normally reduce the position size.
Using ATR for position sizing
ATR can be combined with a predetermined risk amount to calculate position size. The trader first decides how much money can be lost on the trade and then uses the ATR-based stop distance to determine how many shares, contracts or units can be traded.
Assume a trader is willing to risk $200 on a trade. The selected stop is two ATR from the entry and the ATR is $1. This produces a $2 stop distance. Dividing the $200 risk allowance by the $2 stop distance gives a theoretical position size of 100 shares before considering commissions, slippage and other costs.
If the ATR later rises to $2 and the trader still wants a two-ATR stop, the stop distance becomes $4. Keeping the same $200 maximum risk would reduce the position size to approximately 50 shares.
This approach automatically reduces exposure as volatility increases and permits somewhat larger positions when volatility falls. It does not guarantee a profitable trade, but it can make the amount at risk more consistent across markets with very different price behaviour.
ATR and breakouts
Breakout traders sometimes use ATR to judge whether a move is large enough to stand out from recent market noise. If an asset normally moves $2 per day and suddenly breaks through resistance with a $6 daily range, the expansion in volatility can support the idea that something unusual is happening.
A rising ATR during a breakout can therefore show that the move is occurring with greater price expansion. A breakout accompanied by very low and declining ATR can be treated more cautiously by traders who prefer strong volatility expansion.
This does not mean a high ATR confirms that the breakout will continue. A failed breakout can also produce a large true range. ATR can describe the scale of the move, but another part of the trading method must decide whether the direction is attractive.
ATR and trend trading
Trend traders can use ATR to adapt exits as a market moves. When volatility increases, a fixed stop can become too tight and repeatedly remove the trader from otherwise healthy trends. An ATR-based trailing stop can widen automatically as price movement becomes larger.
ATR can also help distinguish quiet consolidations from periods of expansion. A market can trend while ATR is rising, falling or remaining stable, so the indicator should not be used to determine trend direction by itself. Price structure or another directional method is still needed.
Some traders watch for periods of unusually low ATR because quiet markets are sometimes followed by stronger moves. This is not a guarantee of an imminent breakout, but prolonged volatility contraction can be useful context when combined with support, resistance or chart patterns.
ATR on different markets
ATR can be used on many asset classes because the underlying idea is simply to measure recent price movement. The interpretation needs to reflect the way each market is quoted.
On a share chart, ATR is normally expressed in the currency used to quote the stock. If a share has an ATR of $3, the recent average true range is approximately $3 per selected period. A $30 share with a $3 ATR is much more volatile relative to its price than a $300 share with the same $3 ATR.
In forex, traders often convert the ATR reading into pips. A currency pair with a daily ATR of 40 pips has recently moved much less than a pair with a daily ATR of 180 pips. This can influence both stop placement and expectations for realistic daily targets.
Futures and commodity traders can use the same method, although contract specifications need to be considered when converting an ATR value into monetary risk. A one-point move can have a very different financial value depending on the contract.
Comparing ATR between assets
Raw ATR values should be compared carefully because assets trade at different prices. A $10 stock with a $1 ATR and a $1,000 stock with a $10 ATR do not have the same relative volatility even though the second one has the larger absolute ATR.
Some traders divide ATR by the current asset price to create a percentage measure. This can make it easier to compare markets with very different price levels. An ATR equal to 5% of the asset price indicates more relative movement than an ATR equal to 1%.
This percentage approach can be particularly useful when screening many shares. Looking only at raw ATR might cause high-priced stocks to appear automatically more volatile simply because every point of movement represents a larger number of dollars.
What happens when ATR rises?
A rising ATR indicates that recent trading ranges are becoming larger. This commonly happens during strong market moves, periods of uncertainty or after important news causes participants to reprice an asset rapidly.
Higher volatility can create larger profit opportunities because prices move further, but it can also create larger losses. Traders using fixed position sizes can suddenly find that the same number of shares or contracts produces much larger changes in account value than it did during quieter conditions.
This is why ATR can be useful for adjusting position size. If volatility doubles, a trader may decide to reduce exposure rather than allowing the amount at risk on each trade to double as well.
What happens when ATR falls?
A falling ATR shows that price ranges are becoming smaller. This can happen during consolidations, quiet trading periods or stable trends where the market continues moving but does so with relatively little daily variation.
Low volatility can frustrate traders whose strategies require large price movements. A breakout or momentum method may produce fewer opportunities if the market spends long periods moving within narrow ranges.
Other strategies can perform better during calmer conditions. ATR does not say whether low volatility is good or bad. It simply describes the environment, leaving the trader to decide whether that environment suits the trading method being used.
What is the chandelier exit?
If you want to use the chandelier exit, place a trailing stop under the highest high for the price, measured from when you opened the position. How far under? The answer is that the distance between the highest high and the stop level is defined as some multiple times of the ATR.
Example: Subtract three times the value of the ATR from the highest high, and place your stop there.
The chandelier exit was developed by Chuck LeBeau.
The name comes from the idea that the stop hangs below the market in much the same way that a chandelier hangs from a ceiling. As the highest price increases, the stop can move upward with it. If the market begins falling and reaches the trailing level, the position is closed.
The ATR component makes the stop responsive to volatility. If price swings become larger, the distance between the high and the stop can increase. If volatility falls, the trailing distance can become smaller.
For short positions, the concept can be reversed. A trader can place the trailing stop above the lowest low using an ATR multiple. The purpose remains the same: allow enough room for ordinary price movement while gradually protecting gains if the trend continues.
ATR compared with standard deviation
ATR is not the only way to measure volatility. Standard deviation is another common approach and is used in indicators such as Bollinger Bands. The two methods measure volatility differently.
ATR focuses on actual trading ranges and gaps between periods. Standard deviation measures how widely values vary around an average. Both can identify changing volatility, but they are not interchangeable and can respond differently to the same price behaviour.
Traders do not necessarily need to choose one permanently. ATR can be useful for stops and position sizing, while standard deviation can be more suitable for strategies built around statistical dispersion from a moving average.
ATR compared with Bollinger Bands
Bollinger Bands visually place volatility around the price chart, while ATR is normally displayed as a separate line. Bollinger Bands expand and contract according to standard deviation, whereas ATR rises and falls according to true range.
A trader looking for volatility contraction can use either indicator, but the presentation is different. Bollinger Bands show contraction directly around price. ATR provides a numerical measure that can be incorporated into formulas for stops, targets and position sizes.
Using several volatility indicators at the same time does not necessarily provide more useful information. If multiple indicators are measuring almost the same market characteristic, they can simply repeat the same message in different forms.
Common mistakes when using ATR
One common mistake is treating a high ATR as a bullish signal. High ATR only means that ranges have become larger. The price can be rising sharply or collapsing just as quickly.
Another mistake is comparing raw ATR numbers across instruments without considering price. An ATR of $5 can be enormous for one stock and relatively small for another. Relative volatility should be considered when comparing different assets.
Traders can also make the mistake of using one ATR multiple for every strategy and market without testing it. A one-ATR stop might work adequately for one instrument and be far too tight for another trading method.
ATR is based on historical prices, so it cannot predict the size of the next move with certainty. An asset with an ATR of $3 can still move $10 tomorrow if unexpected news arrives. The value is an average based on previous periods, not a maximum range.
ATR is a lagging indicator
Like most indicators calculated from historical prices, ATR reacts to what the market has already done. A sudden volatility spike will cause ATR to rise, but the indicator cannot know about that spike before it happens.
This is not necessarily a weakness. Traders often use ATR to adapt their behaviour to current conditions rather than predict the exact next event. If volatility has already increased, position sizes and stop distances can be adjusted accordingly.
The problem begins when ATR is treated as a forecasting tool capable of predicting direction or guaranteeing the size of future price movements. It was not designed for either purpose.
ATR and profit targets
ATR can also help traders set more realistic profit targets. If an asset has recently moved an average of $2 per day, expecting a routine $15 move before the end of the session might be unrealistic unless an unusual event is taking place.
A trader can use fractions or multiples of ATR when planning targets. For example, a short-term trader might consider whether a target equal to half the current ATR is reasonable given how far the market has already moved during the session.
This should not become a rigid rule. Markets occasionally move several times their recent ATR during major news events. ATR is better used as context for judging what has been normal recently rather than as a ceiling that price cannot exceed.
ATR for day traders
Day traders can apply ATR to intraday charts or use a daily ATR to estimate how much movement might reasonably remain during a session. Both approaches answer slightly different questions.
An ATR on a five-minute chart describes recent five-minute volatility and can be useful for short-term stop placement. A daily ATR gives broader context. If a currency pair has already moved nearly its full recent daily ATR before midday, a trader might be more cautious about assuming another equally large move will automatically follow.
This does not mean the market cannot continue. Strong trend days can substantially exceed the recent average range. The ATR simply gives the trader a reference point for how unusual the day’s movement has become.
ATR for swing traders
Swing traders can use ATR to account for the larger price movements that occur over several days. A stop that works on a five-minute chart can be useless for a position intended to remain open for two weeks.
Daily ATR is commonly used for this purpose because it shows the typical amount an asset has recently moved during one trading day. Traders can then set stops far enough away to avoid being removed from a position by ordinary daily fluctuation.
Position size can be reduced when the required stop becomes wider. This allows the trader to give a volatile market more breathing room without automatically increasing the amount of money placed at risk.
Important
- ATR does not indicate price direction, it only indicates (historic) volatility.
- ATR does not indicate in which direction a breakout will occur.
- There is no single ATR value that will tell you for sure that a trend is about to reverse, or guarantee that a trend is not about to reverse.
ATR is most useful when it is treated as a measurement tool rather than a complete trading system. It can tell you how much a market has been moving, help adjust stop distances and make position sizing more consistent. It cannot tell you whether to buy or sell without some other method for determining direction.
The indicator also needs to be interpreted in context. A high ATR for one asset might be completely normal, while the same relative increase in another market could represent an unusual volatility event. The period setting, chart interval and trading strategy all influence how the number should be used.
Used correctly, ATR can answer a practical question that every trader eventually faces: how much is this market actually moving right now? That information can make stops, targets and position sizes better suited to current conditions instead of relying on fixed numbers that ignore volatility.